Is global liquidity now hostile for equities?
Last week I said that investors have plenty to worry about, but also that many of the traditional reasons to abandon ship—chiefly extended valuations and political paralysis and risk—perhaps weren't as valid as many think they are. The most convincing argument for not panicking despite extended valuations is that ample global liquidity and low interest rates remain as support for equities and credit markets. I imagine that his idea has been put down on page one of most investors' playbook since the financial crisis. The argument is pretty simple. As long as central banks are on the bid, their purchases of bonds—and other assets—will drive private investors into riskier markets. Known as the portfolio balancing effect, this is recognised to operate via both the stock and flow of central banks' balance sheets. Finally, front-end interest rates that are locked at the zero bound—or slow to rise even as the economy recovers—also translates into higher equity prices and tighter spreads. Low rates mean an increase in the future discounted value of cash flows and also encourages investors to pay a higher multiple for the same level of earnings. It also forces investors to seek out yield in private debt markets to reach their return targets, despite the higher risk profile of corporate bonds.
Academics, investors and private sector researchers have been butting heads for the best part of a decade to figure out exactly what unconventional monetary policy means for asset prices. Most agree that it matters, but the question of stocks vs flows as well as the importance of international capital flows in transmitting central bank policies across markets remain thorny and unresolved issues. I can't possibly resolve these matters here, but the question I am asking this week is fairly straightforward. Are central bank purchases of assets becoming less supportive for equities?
The state of play is as follows. The Fed is raising rates and contemplating how the slowly start unwinding its balance sheet, so markets aren't getting much help here. But others are providing offsetting support. In the Eurozone, the ECB probably will reduce the pace of QE next year, but the duration of QE also likely will be extended. The central message from Mr. Draghi and his colleagues appear to be that the ECB intends to remain accommodative for a long time, even if the degree of stimulus will be reduced as the economy improves. This sustained stimulus by the ECB has created offshoot pockets of stimulus in countries where central banks are desperately trying to avoid being flooded with all the euros Mr. Draghi is printing. The key example here is the SNB—from the point of view of asset purchases—while interest rate policies in Denmark and Sweden have been similarly affected. In Japan, the BOJ has opted for the nuclear solution in the form of a price target on its 10-year yield, of 0% no less. Many analysts have emphasised that the extent to which the market perceives this as a credible commitment, the bank should be buying fewer bonds. But it also means that if yields creep higher, the BOJ has now effectively committed itself to unlimited purchases of bonds to ensure that its sovereign can issue 10-years bonds virtually for free. This doesn't seem to be an environment in which global liquidity is turning hostile for risk assets. Not everyone agrees. Citigroup's Matt King and team—who are excellent—are worried and one of their recent notes has created waves. The first part of Mr. King's argument is that flows matter much more than stocks, which leads him to the second part; markets are too complacent about the prospect of a reduced pace of central bank balance sheet expansion. From the horse's mouth:
Markets seem optimistic that central bank plans to modestly reduce their support for markets in coming months can be achieved without disruption. We are not convinced. We find evidence that markets have responded to the flow of QE rather than the stock, and that it has worked globally rather than locally. This implies that even small balance sheet adjustments may create outsized responses in markets – especially when several central banks are adjusting policy simultaneously.
We reckon tapering would be less disruptive if market valuations were fair rather than expensive, and if investors did not feel they had been pushed into taking risks beyond those merited by fundamentals. This suggests a potential way out for the central banks: copy the BoJ’s shift away from targeting quantity to targeting stability in markets instead. As it is, we expect another tantrum.
I have sympathy for these points. I agree that flows of purchases matter more than the stock, and I also think that Japan's decision to go for a price-target is potentially more important for the pace of purchases than markets believe. It could turn out to be bullish for risk assets if the commitment is credible. Mr. King and his team present the following chart, though, which suggests that the flow of purchases already is pointing to downside risk for equities. An important side point is that Citi includes FX reserves in their proxy for global liquidity, which I agree with in light of how reserve managers with cash to spend usually behave. This is to say; they tend to buy the same assets as QE wielding central banks do.

As much as I agree with Matt King's underlying arguments, I am not impressed with this framework. Specifically, I think City are playing a little bit too much with the axis on the right-hand chart. The fit looks good, but the skewed axes mean that asset purchases at zero on a three-month basis are equivalent to trailing returns on the MSCI World of -10%. I am not sure that is a good rule of thumb. Whatsmore, and potentially more problematic, I can't replicate it; and yes I have run models with three-month returns too despite the charts below being with six-month trailing changes. This could be a result of a number of issues, chiefly of which is probably the difference in the sample of central bank balance sheets. That said, I am still surprised how much my results differ from Citi's.
The chart shown below shows the six-month trailing returns of the MSCI World alongside the six-month change of global central bank balance sheets. My sample is constructed with Fed, ECB, BOJ and SNB balance sheets as well as Chinese FX reserves, all rebased to nominal USD dollars.

My proxy for central bank asset purchases is growing about 9% on a six-month basis, and based on that metric a trailing return on the MSCI World of 9%-to-10% isn't that out of whack. Assuming this situation persists into year end implies that the MSCI World should rise a modest 4% between now and the close on the final trading day of the year. That said, the fit between my central bank asset proxy and equity returns isn't perfect. In 2011, for example, global equities fell off a cliff despite the robust expansion in central bank balance sheets primarily due to the debt ceiling chaos in the U.S. Does that setup remind you of something?
The following set of charts breaks down the central bank liquidity indicator into three separate overviews. The first chart shows the MSCI World returns versus the Fed balance sheet, indicating that the Federales are not in charge at the moment. The Fed balance sheet had a good correlation with equity returns between 2010 and 2015, but global stocks managed to recover just fine from their swoon at the beginning of 2016, despite a flat balance sheet.

The second chart shows that the combined balance sheets of the ECB, the BOJ and SNB is growing about 15% on a six-month basis; growth has even accelerated this year, and I am not sure why Citi's chart doesn't reflect that. After all, the ECB and BOJ are heavy sluggers here no matter how you construct your sample. I admit that the correlation with global equity returns is not perfect, but as long as the ECB and the BOJ are on the bid to the extent which is the case now, I can't see how we can talk about outright hostile central bank policy from the point of view of global equities.

The third chart shows Chinese FX reserves and trailing equity returns. I was surprised to see how close the correlation was here. The plunge in global equities in Q1-16 was heavily influenced by markets' fear of a Chinese devaluation, and this chart supports this story. It shows that stable financial conditions in China—and recycling of capital inflows into foreign assets—are a key driver of global equity returns.
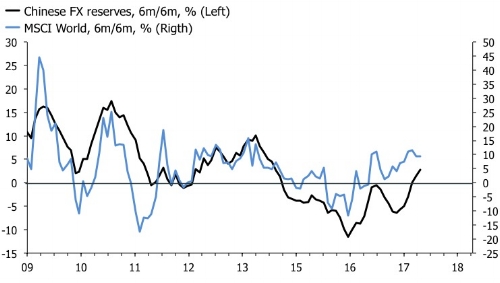
The charts above highlight just how important capital flows in China are for global risk assets. The twin surplus on the balance of payments and a strict currency management regime has been the key driver of Chinese reserve accumulation in the past. But both of these "institutions" of Chinese monetary policy has been ground down at the edges in recent years. The capital account is not so uniformly in surplus as it used to be—which makes sense if you run a trade surplus—and China's commitment to a hard peg to the dollar also has been challenged. The world expected the Chinese currency to appreciate if and when the PBoC stepped back from intervention. But now it seems to me that investors fear a deluge of capital outflows if the PBoC liberalises the capital account. Crucially, it seems to me that markets are assuming that the capital account deficit would be higher than the trade surplus in such a situation. If that is true, it will translate into a weaker CNY unless the PBoC sold FX reserves to keep it pegged to the basket. It also implies that investors worry about a PBoC stepping back because it could lead to reverse flows on the reserve account and a weaker CNY, both of which would be a deflationary impulse to the global economy.
This all sounds worrying, but the global monetary policy setup also offers hope of countervailing measures. After all, if the Chinese currency fell from grace the disinflationary impact of global goods prices probably would prompt other major central banks to ease. I think markets have seen enough evidence of this in the way that the ECB, for example, reacted to another global price shock when oil prices hit the skids in 2014 and 2015. Cyclical inflation pressures are building, but for central banks chasing the same inflation targets as they were a decade ago, the present set-up in the global economy implies that they are being dragged into all kinds of silliness to keep up appearances. The biggest risk for investors is not that they give up, but that they realise they aren't reaching their targets and decide to change them.
What about other measures of global liquidity?
Central bank purchases are not only the only measure of global liquidity; a broader and often used alternative is narrow money growth—M1—which also tends to drive equity prices. I have cheated a bit in the analysis that follows because I have switched to second derivatives. Right now my global measure of real M1 is growing about 10% year-over-year, which is not a signal of a calamitous recession. But momentum has slowed, and that matters for equity prices too. The chart below shows second derivates of real M1 growth and the MSCI World. Its message is grim reading for equity bulls.
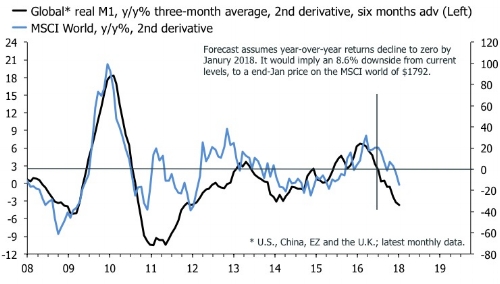
It is important to be very specific in the way we interpret the chart above. The second derivative of year-over-year returns is even less tradable for investors than actual trailing returns are. In a nutshell, the decline in the momentum of real M1 growth suggests that year-over-year returns will decline to about zero in the first quarter of 2018. If we use this prediction to back out a level, we are looking at about 10% downside for the MSCI World in the next six months. I like this as a working assumption. It would be enough to shake the faith of the bulls, but not enough to satisfy the perma-bears.
So, which is it?
I started out my research for this post with a mind to have a go at Matt King and Citigroup, but there are so many ways to operationalise the support to asset prices from global central bank and liquidity that it wouldn't be honest of me to throw down their version. After all, it is pretty well worked out. Looking exclusively at central bank balance sheets, I agree that they are certainly less supportive now, an argument supported by the inclusion of real M1 growth as an explanatory variable of global equity prices. But combined with negative interest rates in Europe and Japan, I think we can also say that monetary policy remains overall accommodative. In addition, I think the BOJ's decision to shift to a price target needs to be re-emphasised here at the end. To repeat; this is one of the largest central banks in the world committing itself to unlimited bond purchases to maintain a 10-year yield at zero percent. Assuming they stick to it, this is significant, not least because we're talking about an economy with a big external surplus. The combination of QE, negative interest rates and external surpluses is a powerful catalyst for yield seeking global liquidity flows, and I think it is in this holistic perspective that the importance of the BOJ and ECB has to be seen. If this is true, the analysis above could well be omitting one of the most important drivers of global equity prices; gross portfolio outflows from QE wielding surplus economies. In conjunction with the fact that Chinese FX reserves are rising again, it adds to my conviction that while global liquidity conditions are becoming less supportive for risk assets, they are not yet outright hostile.