Markets in Q1 - jusqu'ici tout va bien
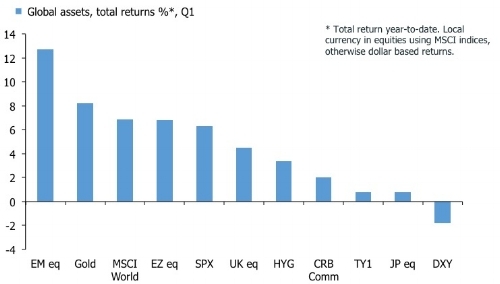
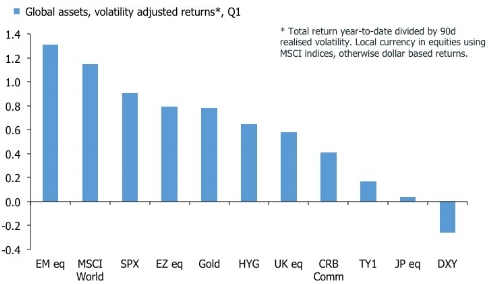
The first quarter was a pleasant one for investors. It was difficult not to make money on the long side in equities, while it remained slim pickings for bears. Bonds and credit rallied too, albeit less vigorously, and commodities also pushed ahead. The USD-bull story, however, fell by the wayside. My two first charts put some numbers to this. The first shows the total return-to-date for the main asset classes, and the second adjusts for volatility. Equities did the heavy lifting—with EM on top and Japan trailing—but the 8.2% jump in gold is also interesting. Not many have really talked about this, but it has benefited the portfolio in an environment where its core equity positions has been left behind by roaring benchmark indices. High yield credit in the U.S. has also pushed higher without much ado, while commodities have trailed. U.S. govvies have underperformed although, the 10-year bond reasserted itself towards the end of the quarter. Finally, king dollar was demoted to Jester.
No one ever got rich from talking about the past, but I suspect that the U.S. 10-year note will command a better position when I update the charts above in three months. I also expect to see more negative bars to reflect growing disappointment with the reflation trade— or simply mean reversion—following the soaring start to year. In the main, I am still betting on defensive equity sectors to deliver the goods this year. Beyond that, do take the time to have a look at the chart tour Abee recently did over at the MM blog, which provides an excellent overview of the state of play.
The outperformance of emerging markets also should be durable at least for a while. The next chart shows that EEM inflows—on a three-month basis—have just recently picked nudged above zero. Commodities inflows also appear to be turning up from a depressed level. Given the overweight of China in the EEM, and the tight link between China and commodities, it suggests that this trade is not done yet.

The portfolio has not enjoyed the rally in the headline EM index, but it is positioned for upside in this space via some single equity positions in Latin America; both have done well recently. This is probably a good time then to point out that not all emerging markets are made of the same stuff. For example, if your EM strategy has been overweight Turkey and South Africa recently, your performance would have looked very different than the charts above. In the end, though, for EEM punters the key market is China and they will be happy to see that real M1 growth snapped back in February following the seasonal plunge in January. The Q1 data in China are always chaotic due to the odd timing of New Year celebrations. By contrast, the U.S. index retreated sharply in February as M1 growth slid, and inflation pushed higher. In general, excess liquidity—the residual of money supply growth less inflation and nominal GDP—is rolling over in most OECD economies, although I concede that it is probably still accelerating in China.
Playing the "relative" performance game
I have shown a plethora of charts in the last six months to indicate that U.S. equities were liable for a stumble, and I count myself relatively moderate on this question. If you want bearish charts on the S&P 500–and global stocks in general—I am sure you know where to go. But what about one, which suggests upside for U.S. equities. Hold my beer.
The chart above shows that EM equities ran ahead of the U.S. market in Q1, and most recently equities in the euro area have also started to edge the S&P 500. This is not unprecedented, but my model which backs out a price for Spoos based on the the returns of other global equity indices—presented here—currently suggest that the index is 3%-to-4% undervalued. Readers trained in the dark arts of quantitative analysis will undoubtedly have several valid objections. Their main gripe probably is that this model won't capture the very change in correlation, which would allow the S&P 500 to underperform for a sustained period in the first place.

I accept that complaint, but we need to be very careful about what we're assuming then. If EM and EZ equities continue to race higher, it is difficult to tell a story of the U.S. equities falling outright, at least not much. But I will accept sideways price action. Alternatively, we might conjecture that the it is the S&P 500 that is right, and that the other benchmark indices will simply correct to the downside. But if that's the case, we can't go on and buy EM equities. No one told us that this was going to be easy. A cynic would note that equity strategists' pivot to EZ and EM equities as an "overweight" is a classic late-cycle story, when it's obvious that the game is up for further aggressive gains in the U.S.
Returning to real world of absolute valuations restores the idea of EM equities as a relatively good bet, and raises serious question of why anyone would argue EZ equities are cheap. The chart below shows the percentile rank—where 1 is the all-time highest and 0 is the all-time lowest—of the price-to-sale ratios in the U.S., the EU ex-UK and EM. The choice of price-to-sales ratio is important. It is the closest we come to mean-reverting multiples, and they also tend to avoid the likelihood of earnings manipulation which can screw up P/E multiples.
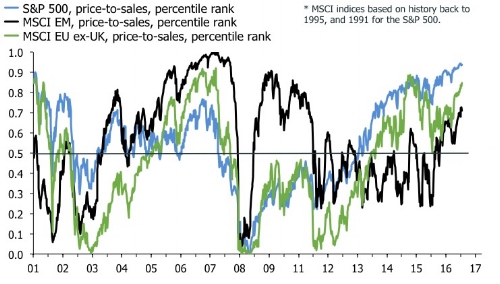
It doesn't look good for good old Spoos here, and its almost as ugly for euro area equities. By contrast, EM equities have further room to run even though they don't exactly look cheap either. It helps, though, if we consider that many non-OECD countries have recently come out of recessions or prolonged slowdowns. This compares to the U.S. and Europe where the cycles are longer in the tooth. Allow me to cede the floor to Cameron Crise, who is now properly warmed up in his role as Bloomberg's Macro Man reborn.
It’s pretty easy to argue that U.S. equities, for example, are fully valued. Last week I published a post suggesting that the SPX was 20% overvalued vs. economic fundamentals. The real earnings yield of the index, meanwhile, is the lowest it’s been since 2008. While neither of these factors is necessarily decisive, they both suggest that U.S. stocks could do with letting some air out, for reasons that have nothing to do with Donald Trump or Congress.
(...)
In sum, I can see arguments for lightening up on U.S. risk. But do so with eyes open; a lot of what you see is down to positioning, and under the surface the outlook for EM outperformance remains as strong as ever.
The key word here is "outperformance," and my query above raises the question of just how much air the S&P 500 can let out while EMs power higher. Eventually, you would imagine some sort of gravity will set in. That said, EM's have been trailing developed market equities for ages, and if they truly had to catch up, it would be a whole new regime in global markets.
I can't help but feel, however, that piling in to EMs at this point is a bit like the final scene of the French cult movie La Haine. All is well that ends well, right?